
A Pareto chart can help identify where to investigate first. Its value comes from the actual distribution, not from making every dataset resemble a familiar ratio.
ASQ presents Pareto charts as tools for displaying categories in descending order of frequency or another selected measure. ASQ — pareto.
Choose one meaningful measure
For a plush-production review, frequency, cost and severity answer different questions. State which measure is being plotted. A high count of cosmetic observations should not silently outrank a less frequent concern with a different consequence.
Look beyond the tallest bar
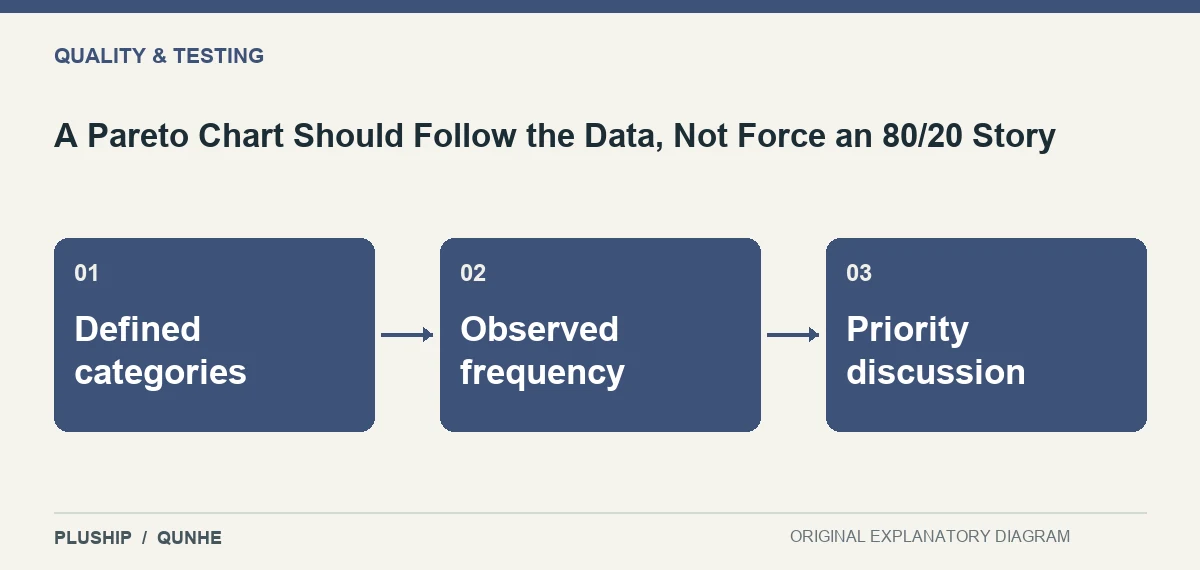
Check category definitions and the data-collection period before deciding what to investigate. A broad category may appear dominant simply because it combines several unrelated issues. Break it down only when the underlying records support the distinction.
Use the chart to prioritise inquiry, then collect evidence about causes. A ranked bar is not proof of a root cause, and the chart does not establish what corrective action will work.
Source reviewed 25 October 2026. Practical interpretation and original illustrations by PLUSHIP / Qunhe; examples are illustrative.
Related reading
Acceptance Sampling Does Not Inspect Every Unit
A Check Sheet Collects Data; a Checklist Prompts Action
A Fishbone Diagram Organises Possible Causes, Not Proven Causes